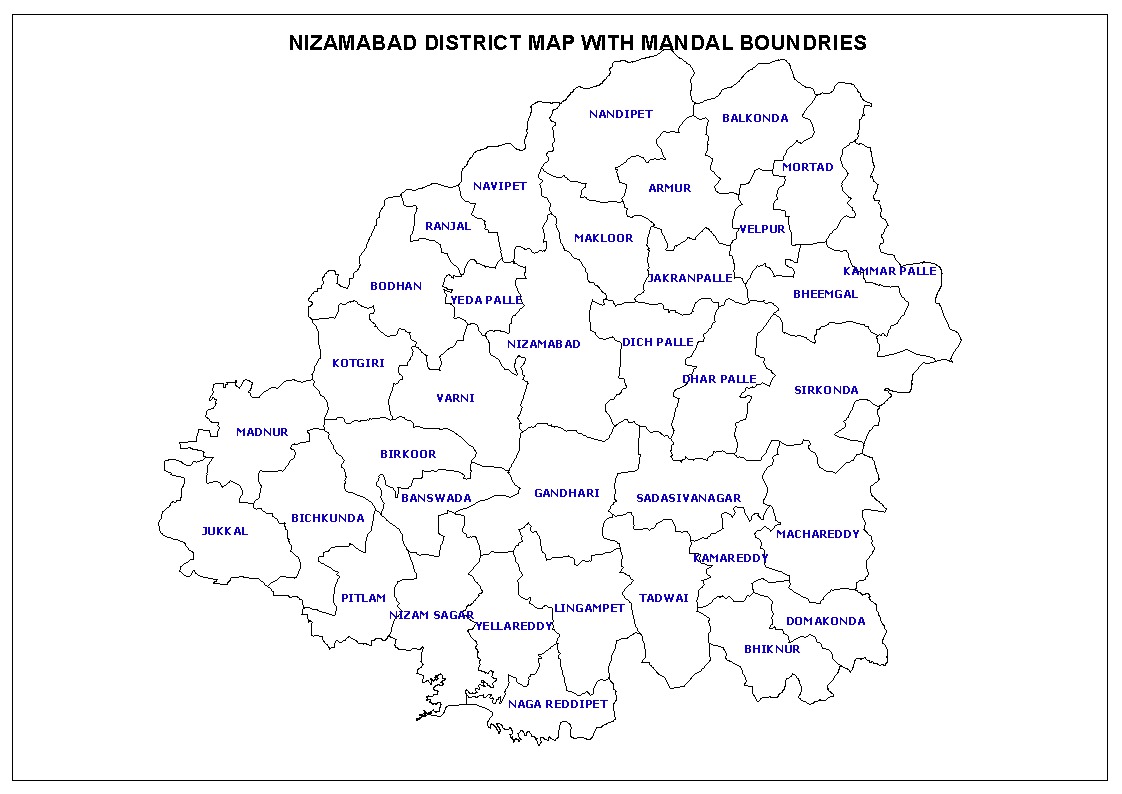
Nizamabad District MAP
Nizamabad District at Glance |
|---|
1. Demographic Particulars
2. HEALTH 2015
3. Seasonal Conditions 2014-15
4. Agriculture 2014-15
5. Livestock Census - 2012
6. State Income 2014-15
7. Industry - 2009-10
8. Power Consumption-(Provisional) (Low Tension)
9. Transport and Communications
10. Banks As on March 2015-16
11. Education 2014-15
| Sl. No. | Item | Unit | Nizamabad |
| 1 | 2 | 3 | 4 |
|---|---|---|---|
| Demographic Particulars | |||
| 1 | Area | Sq.Kms | 7956.0 |
| 2 | Population as per 2011 Census | ||
| a) Total population | No. | 25,51,335 | |
| b) Males | " | 12,50,641 | |
| c) Females | " | 13,00,694 | |
| Percentage decadal growth rate of population | |||
| a) 1991-01 | % | 15.12 | |
| b) 2001-11 | % | 8.77 | |
| Sex- Ratio (Number of Females per 1000 Males) |
|||
| a) 2001 | No. | 1017 | |
| b) 2011 | " | 1040 | |
| Population density per sq. km. |
|||
| a) 2001 | No. | 295 | |
| b) 2011 | " | 321 | |
| Population(0-6 years) | |||
| a) Total population | No. | 282417 | |
| b) Males | " | 144977 | |
| c) Females | " | 137440 | |
| Literates | |||
| Male | No. | 790214 | |
| Female | " | 599596 | |
| Total | " | 1389810 | |
| Literacy Rate | |||
| Male | % | 71.47 | |
| Female | " | 51.54 | |
| Total | " | 61.25 | |
| Urban Population | " | 588372 | |
| Urban Population as % to Total Population | % | 23.06 | |
| Rural Population | No. | 1962963 | |
| Rural Population as % to Total Population | % | 76.94 | |
| No.of Households | " | 593234 | |
| Scheduled Caste Population | " | 371074 | |
| Scheduled Tribe Population | " | 192941 | |
| 3 | Population (As per 2001 Census) | ||
| a)Total Population | No | 2345685 | |
| b)Urban Population | " | 424738 | |
| c)Urban Population as % to Total Population | % | 18.11 | |
| d)Rural Population | No. | 1920947 | |
| e)Rural Population as % to Total Population | % | 81.89 | |
| f) Population(0-6 years) | No. | 337429 | |
| g)No.of Households | " | 484588 | |
| Density of Population (per sq.km) | " | 293 | |
| Scheduled Caste Population | " | 348158 | |
| Scheduled Tribe Population | " | 165735 | |
| Literates | |||
| Male | No | 642996 | |
| Female | " | 401792 | |
| Total | " | 1044788 | |
| Literacy Rate | |||
| Male | % | 64.9 | |
| Female | " | 39.5 | |
| Total | " | 52 | |
| Classification of Workers (As per 2011 Census) | |||
| (A) Total Workers (i+ii) | No | 1261076 | |
| i ) Main Workers | " | 1055965 | |
| ii)Marginal Workers | " | 205111 | |
| a) Cultivators | " | 278102 | |
| b)Agriculture Labourers | " | 448281 | |
| c)Household Industry | " | 171311 | |
| d)Other Workers | " | 363382 | |
| (B) Non-Workers | " | 1290259 | |
| 4 | Administrative Divisions | ||
| Revenue Divisions | " | 3 | |
| Towns | " | 8 | |
| Revenue Mandals | " | 36 | |
| Mandal Parishads | " | 36 | |
| Gram Panchayats | " | 718 | |
| Revenue Villages as per 2001 Census | " | 912 | |
| a)Inhabited Villages | " | 847 | |
| b)Un-inhabited Villages | " | 65 | |
| Sl. No. | Item | Unit | Nizamabad |
| 1 | 2 | 3 | 4 |
|---|---|---|---|
| HEALTH 2015 | |||
| Allopathic | |||
| a)Hospitals | No. | 7 | |
| b)Primary Health centres | " | 41 | |
| c)Hospital beds | " | 1486 | |
| d)Dispensaries | " | 2 | |
| e)Doctors | |||
| Regular | No. | 187 | |
| Contract | " | 66 | |
| Ayurveda | |||
| a)Dispensaries | No. | 39 | |
| b)Doctors | " | 19 | |
| Homoeopathy | |||
| a)Dispensaries | No. | 19 | |
| b)Doctors | " | 4 | |
| Unani | |||
| a)Dispensaries | No. | 15 | |
| b)Doctors | " | 9 | |
| Sl. No. | Item | Unit | Nizamabad |
| 1 | 2 | 3 | 4 |
|---|---|---|---|
| Seasonal Conditions 2014-15 | |||
| 6 | Seasonal Conditions | ||
| a)Normal Rainfall (2014-15) | mms | 1035.5 | |
| b)Actual Rainfall (2014-15) | " | 661.9 | |
| c) Percentage Deviation | % | -36 | |
| Sl. No. | Item | Unit | Nizamabad |
| 1 | 2 | 3 | 4 |
|---|---|---|---|
| Agriculture 2014-15 | |||
| 7 | Agriculture 2014-15 | ||
| Gross Cropped Area | Hects. | 449697 | |
| Net Cropped Area | " | 290037 | |
| a) Gross Irrigated Area | " | 304004 | |
| b) Gross Area Irrigated as % to total cropped area | % | 67.6 | |
| Net Irrigated Area | Hects. | 165485 | |
| Area under Principal Crops 2014-15 | |||
| a) Rice | Hects. | 169272 | |
| b) Jowar | " | 7862 | |
| c) Bajra | " | 6063 | |
| d)Maize | " | 57654 | |
| e) Red Gram | " | 3380 | |
| f)Bengal gram | " | 7971 | |
| g)Black Gram(Mash) | " | 4833 | |
| h)Greeen Gram | " | 6652 | |
| i)Horse Gram | " | 0 | |
| j)Chillies | " | 1036 | |
| k)Onions | " | 2278 | |
| l) Groundnut | " | 883 | |
| m)Castor | " | 0 | |
| n) Sesamum | " | 5159 | |
| o)sunflower | " | 6827 | |
| p)Cashewnut (Bearing Area) | " | 0 | |
| q) Cotton | " | 15795 | |
| r)Tobbaco | " | 945 | |
| s) Sugarcane (Gur) | " | 5429 | |
| t) Coconut (Bearing Area) | " | 0 | |
| u) Turmeric | " | 12458 | |
| v)Banana | " | 44 | |
| w)Mangoes(Bearing Area) | " | 1466 | |
| Production in tonnes | |||
| a) Rice | Tonnes | 620525 | |
| b) Jowar | " | 11420 | |
| c) Bajra | " | 5681 | |
| d)Maize | " | 284000 | |
| e) Red Gram | " | 886 | |
| f)Bengal gram | " | 9358 | |
| g)Black Gram | " | 1577 | |
| h)Greeen Gram | " | 2420 | |
| i)Horse Gram | " | 0 | |
| j)Chillies | " | 3825 | |
| k)Onions | " | 69156 | |
| l) Groundnut | " | 2506 | |
| m)Castor | " | 0 | |
| n) Sesamum | " | 2409 | |
| o)Sunflower | " | 8875 | |
| p)Cashewnut | " | 0 | |
| q) Cotton (Lint) | Bales | 18861 | |
| s)Tobbaco | Tonnes | 3664 | |
| t) Sugarcane(Gur) | " | 47449 | |
| u) Coconut ('000) | No. of Nuts | 0 | |
| v) Turmeric | Tonnes | 47004 | |
| w)Banana | " | 1856 | |
| x)Mangoes | " | 8877 | |
| Sl. No. | Item | Unit | Nizamabad |
| 1 | 2 | 3 | 4 |
|---|---|---|---|
| Livestock Census - 2012 | |||
| 8 | Livestock Census - 2012 | ||
| Livestock Population (with out dogs) | No | 21,53,159 | |
| Veterinary Institutions as on 2014-15 | 135 | ||
| Veterinary Hospitals | No. | 10 | |
| Livestock Supervisory Units (Veternary Despensaries) | " | 67 | |
| Rural Livestock Units | " | 57 | |
| Sl. No. | Item | Unit | Nizamabad |
| 1 | 2 | 3 | 4 |
|---|---|---|---|
| 1 | Gross District Domestic Product at current prices for the year 2014-15(FRE) | Rs.in Lakhs | 2258483 |
| 2 | Net District Domestic Product at current prices for the year 2014-15(FRE) | Rs.in Lakhs | 2063334 |
| 3 | Per capita Income at current prices for the year 2014-15(FRE) | Rupees. | 78828 |
| 4 | Gross District Domestic Product at constant (2011-2012) prices for the year 2014-15 (FRE) | Rs.in Lakhs | 1,779,631 |
| 5 | Net District Domestic Product at constant (2011-2012) prices for the year 2014-15 (FRE) | Rs.in Lakhs | 1614785 |
| 6 | Per capita Income at constant (2011-2012) prices for the year 2014-15 (FRE) | Rs. | 61692 |
| Sl. No. | Item | Unit | Nizamabad |
| 1 | 2 | 3 | 4 |
|---|---|---|---|
| Industry - 2009-10 | |||
| 10 | Industry - 2009-10 | ||
| a)No.of factories | No. | 519 | |
| b)Employees | " | 203775 | |
| c) Value of Output | Rs. in Lakhs | 379665 | |
| d)Value of Input | " | 272330 | |
| e)Net value added | " | 102340 | |
| f)Total emoluments | " | 62648 | |
| Sl. No. | Item | Unit | Nizamabad |
| 1 | 2 | 3 | 4 |
|---|---|---|---|
| Power Consumption-(Provisional) (Low Tension) | |||
| 11 | Power Consumption-2014-15(Provisional) (Low Tension) | ||
| a)Domestic | in MkWh | 3,29,969 | |
| b)Commercial (Non-Domestic) | " | 89359.00 | |
| c)Industry | 1,25,048 | ||
| d)Agriculture | " | 7,52,678 | |
| Sl. No. | Item | Unit | Nizamabad |
| 1 | 2 | 3 | 4 |
|---|---|---|---|
| Transport and Communications | |||
| 12 | Transport and Communications | ||
| Length of roads as on 2014-15 | Kms | 7,241.47 | |
| a) Under R&B Department | " | 1,941.01 | |
| b) Zilla Parishad and Mandal Parishad (Panchayat Raj) | " | 5,072.96 | |
| c) National Highway | " | 227.50 | |
| Road Density | per '000 Sq.Kms. | ||
| Motor Vehicles(on Road) | No. | 4,22,977 | |
| Vehicle density | per Sq.Km. | ||
| Telephone connections As on 31st 2014-15) | No. | 24,527 | |
| Sl. No. | Item | Unit | Nizamabad |
| 1 | 2 | 3 | 4 |
|---|---|---|---|
| Banks As on March 2015-16 | |||
| 13 | Banks As on March 2015 | ||
| Bank Offices | " | 309 | |
| Average Population per Bank (in '000) | " | 8.00 | |
| Credit Deposit Ratio | % | 92.49 | |
| Sl. No. | Item | Unit | Nizamabad |
| 1 | 2 | 3 | 4 |
|---|---|---|---|
| Education 2014-15 | |||
| 14 | Education2014-2015 | ||
| No.of Institutions | No. | 3,243 | |
| @ | Schools (I - V) | ||
| No.of Schools | No. | 1,860 | |
| Enrolment | " | 167097 | |
| Teachers VII | " | 6,242 | |
| @ | Schools ( I - II / VIII) | ||
| No.of Schools | No. | 572 | |
| Enrolment | " | 76,667 | |
| Teachers | " | 3,862 | |
| @ | Schools (I - XII) | ||
| No.of Schools | No. | 12 | |
| Enrolment | " | 6511 | |
| Teachers | " | 70 | |
| @ | Schools (VI - XII) | ||
| No.of Institutions school | No. | 17 | |
| Enrolment | " | 6,128 | |
| Teachers | " | 229 | |
| @ | Schools (I - X) | ||
| No.of Institutions | No. | 42 | |
| Enrolment | " | 14,597 | |
| Teachers | " | 411 | |
| @ | Schools (VI - X) | ||
| No.of Institutions | No. | 740 | |
| Enrolment | " | 170,212 | |
| Teachers | " | 7,430 | |
| @ | Junior Colleges | ||
| No.of Colleges | No. | 162 | |
| Enrolment | " | 27499 | |
| Teachers | " | 1845 | |
| 15 | Tourist Arrivals As on 31st December, 2015 | No. | |
| Indians | " | 13,819 | |
| Foreigners | " | - | |